How to Contribute to Base R
![]()
May 18, 2023
Contributing to R
R is maintained by the R Core Team
Members of the R Community can contribute in various ways:
- Analysing and fixing bugs
- Translating R’s messages, warnings and errors
- Testing pre-release versions of R
- Developing new features
In this demo we’ll focus on bug fixing!
How you can contribute to a bug
Add a minimal reproducible example (reprex)
For code bugs, it helps to have a minimal reproducible example that demonstrates the bug, using only core R packages.
- Bug might be specific to a given platform/architecture
- If you can’t reproduce the bug, may be “worksforme” or fixed in more recent version
Confirm it is a bug
Check the issue really is a bug in base R
- Is the code working as documented?
- Is the bug in a contributed package?
Example: Not a Bug
https://bugs.r-project.org/show_bug.cgi?id=15971
na1.csv
a, b,  c
1, "b", 1
2, "", 2
 , "b", 3
4,    , 4
5, "NA", 5
na2.csv
b,  c
"b", 1
"", 2
"b", 3
   , 4
"NA", 5`Error in Ops.factor(df1$b, df2$b) : level sets of factors are differentCheck reprex in the development version of R (R-devel)
For confimed bugs, we need to check if they are still an issue in the current R development version.
- rig, the R Installation Manager, makes it easy to install multiple R versions, including R-devel: https://github.com/r-lib/rig
Analyse the issue
Once the bug is confirmed in the development version of R, the bug should be analysed
- For code bugs: use the reprex to identify the root cause
- For documentation bugs: review comments/code/references to understand the issue
Discuss how to fix
Once the bug is fully understood, there should be a discussion about how to fix the code/documentation.
- For code bugs: what the code should do (user interface, statistical approach, etc)
- For documentation bugs: what should or shouldn’t be documented
Propose a fix
If a member of R Core agrees how to fix a bug, but does not commit to fixing it themselves, you may propose a fix
- Propose specific changes to code/documentation in the discussion
- Prepare a patch of the R source files that makes specific changes
How to find a good bug to work on
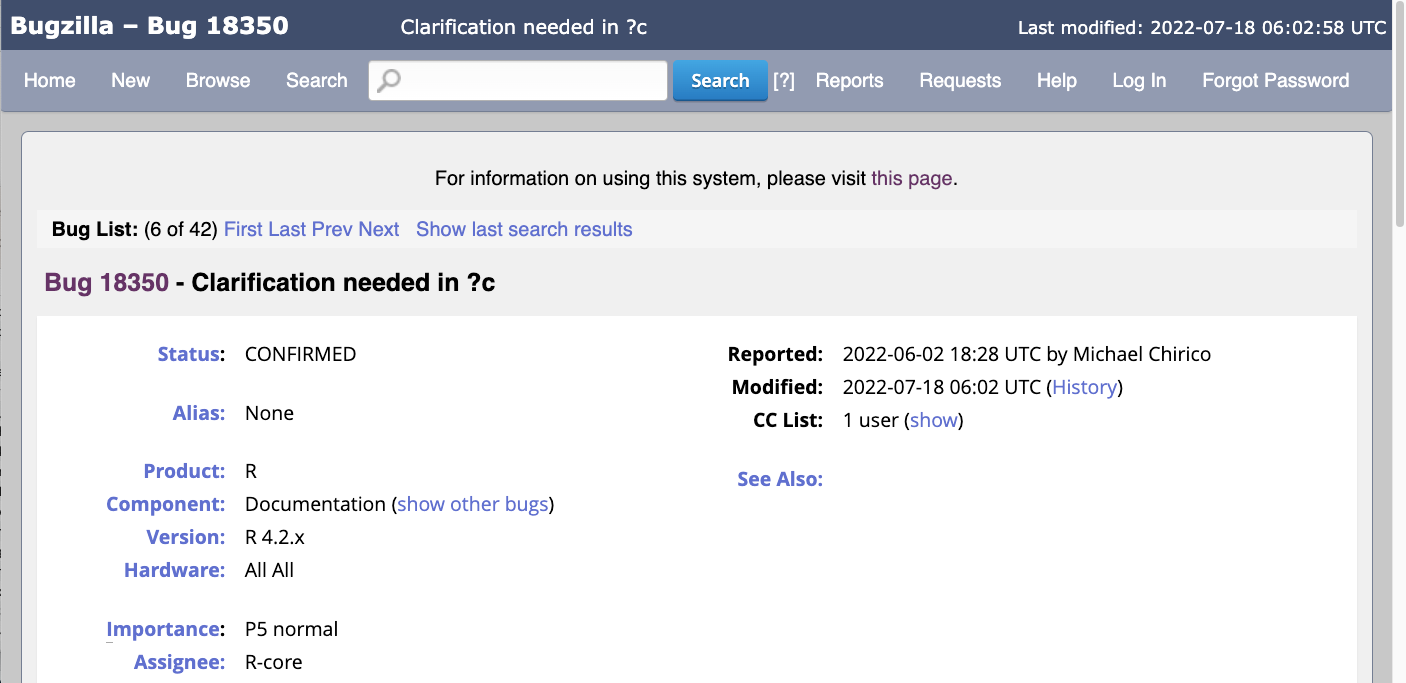
Bugzilla, https://bugs.r-project.org
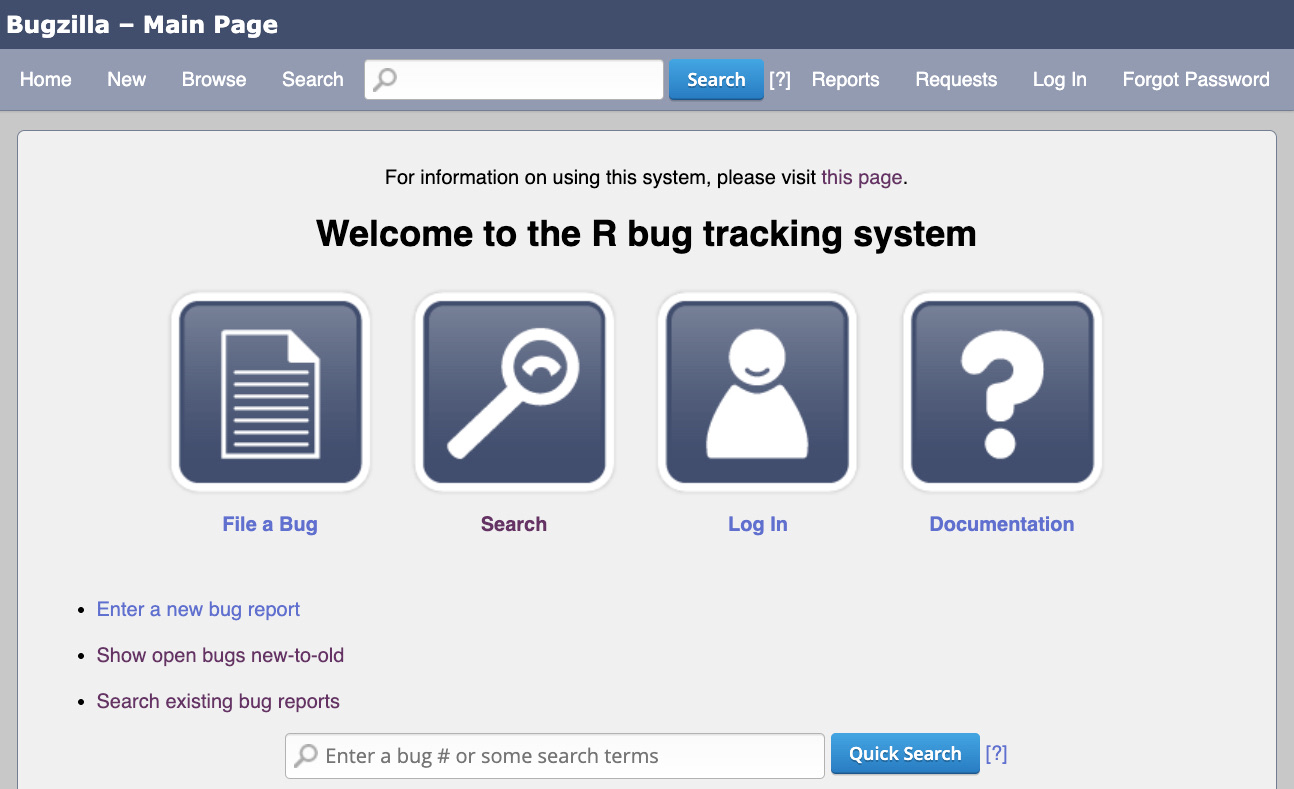
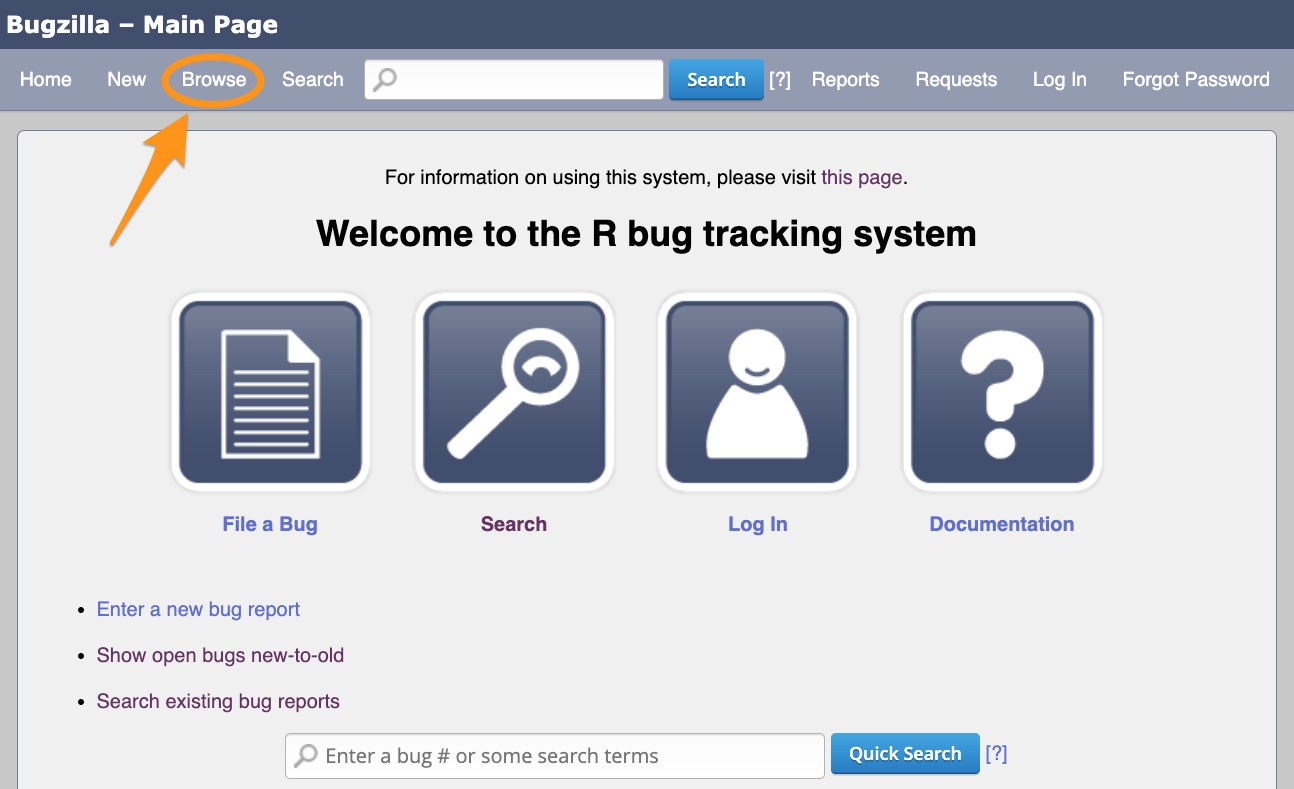
You do not need account to browse bugs on Bugzilla.


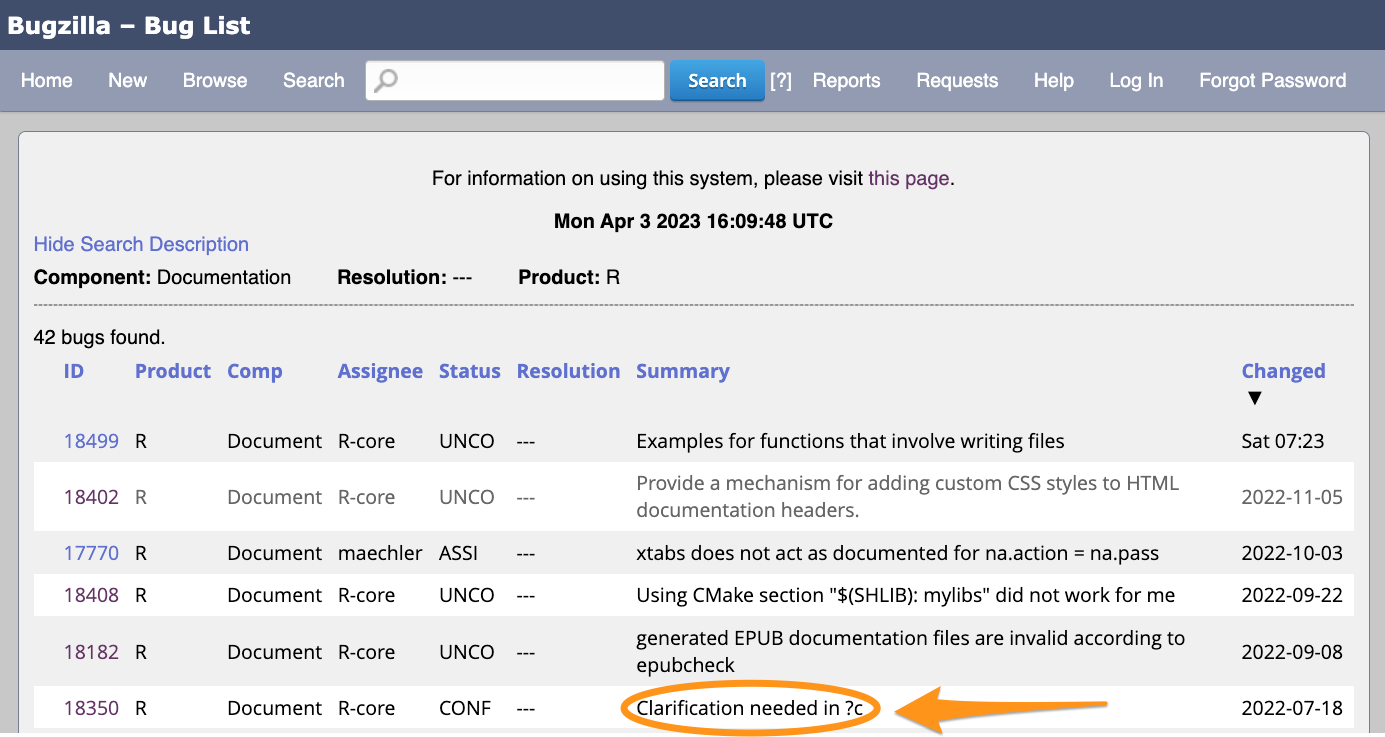
What to look for
Good: a bug report where the next step is clear.
- A minimimal reproducible example
- Checking in R-devel
- A diagnosis
- A fix
Even better: an R Core member supports the next step in a comment.
What to avoid
- Too new
- Too old
- Commenters disagree on how to fix
- Someone else is clearly working on it
- Clearly requires specific expertise you lack
R Core members
When reviewing bug reports, it is helpful to know who is on R Core
Main R Core members active on Bugzilla:
- Martin Maechler
- Tomas Kalibera
- Sebastian Meyer
Triaging bugs exercise
Audience participation!
We will use Vevox to find out what you think about example bug reports.
- Is it a good first issue?
- If yes, what is the next step?
Open vevox.app in a browser.
Enter the code: 116-836-295
(You don’t need to type the dashes).
Bug 18199
https://bugs.r-project.org/show_bug.cgi?id=18199
Summary: “zapsmall is wrong when vector has Inf”
Bug report:
If a vector contains Inf, all the values but infinite become zero.
zapsmall(c(0.1, 0.01)) # correct
[1] 0.10 0.01
zapsmall(c(0.1, 0.01, Inf)) # incorrect
[1] 0 0 Inf
The report has been open for 13.5 hours without comment.
Bug 17616
https://bugs.r-project.org/show_bug.cgi?id=17616
Summary: Anomaly with contrast functions
Report:
If you supply a contrast function to a factor, results depend on whether you pass the name or the actual function. This applies to C(), contrasts()<-, as well as lm(…., contrasts=list()).
Call:
lm(formula = uptake ~ C(Treatment, "contr.treatment"), data = CO2)

Coefficients:
                           (Intercept)
                                 30.64
C(Treatment, "contr.treatment")chilled
-6.86A contributor has commented to confirm the bug.
The last comment was a month ago.
Bug 16305
https://bugs.r-project.org/show_bug.cgi?id=16305
Summary: Seeking more consistent package descriptions and citations
Report:
The following command provides a convenient way of citing R packages
[1] "Warnes GR, Bolker B, Gorjanc G, Grothendieck G, Korosec A, Lumley T, MacQueen D, Magnusson A, Rogers J and others (2014).\\emph{gdata: Various R programming tools for data manipulation}.R package version 2.13.3, \\url{http://CRAN.R-project.org/package=gdata}."However, some packages cannot be formatted this way [2 examples]
Would it be possible to improve consistency in package descriptions and citations?
- 1st example demonstrates issue with non-standard author specification in DESCRIPTION
- 2nd example demonstrates issue with LaTeX commands that require additional packages
Bug has been open for 7 years 9 months
Bug 18362
https://bugs.r-project.org/show_bug.cgi?id=18362
Summary: head(letters, 1:2) should give better error message
Report from R Core member:
The error messages from checkHT() are really really not nice because they mention checkHT() instead of its caller’s call, e.g.,
head(letters, 1:2)
Error in checkHT(n, dx <- dim(x)) :
  invalid 'n' - must have length one when dim(x) is NULL, got 2
- As an extension, also suggests creating an
errorCondition()with its own class and points to some existing examples for reference.
A contributor volunteered to work on this, but it is nearly 1 year since they volunteered
Shortcuts
Get help finding a good first issue:
- R Contributor Office Hours
- R Contributor Slack #work-out-loud channel
Contribution workflow
- Find a good issue to work on.
- Work on the next step(s).
- When you have something useful to contribute add a comment to the report on Bugzilla
- Use markdown formatting to make it easier to read
- Optionally add an attachment to share code or output, with a comment to explain what is in the attachment
- R core is emailed with every comment: avoid trivial comments, e.g. “+1”
- Wait for feedback from R Core (anything from hours to months!)
Use the R Contributors Slack #workout-out-loud channel or Office Hours to get help/feedback before posting on Bugzilla.
Getting an account on Bugzilla
If we want to post anything on Bugzilla (make a bug report or comment on one), we need to get an account.
- Send an e-mail to bug-report-request@r-project.org from the email address that you want to use as your login.
- In this e-mail, briefly explain why you want an account.
- This is a basic spam filter, a sentence is enough.
Getting to the root of the issue
Coding Bug Demo: Bug 17863
https://bugs.r-project.org/show_bug.cgi?id=17863
A 1-factor factor analysis:
Printing the result
Good
Call:
factanal(x = mtcars[, 1:4], factors = 1)

Uniquenesses:
  mpg   cyl  disp    hp
0.199 0.078 0.120 0.261

Loadings:
     Factor1
mpg  -0.895
cyl   0.960
disp  0.938
hp    0.859

               Factor1
SS loadings      3.342
Proportion Var   0.835

Test of the hypothesis that 1 factor is sufficient.
The chi square statistic is 0.5 on 2 degrees of freedom.
The p-value is 0.777
Bad
Call:
factanal(x = mtcars[, 1:4], factors = 1)

Uniquenesses:
  mpg   cyl  disp    hp
0.199 0.078 0.120 0.261

Loadings:
[1] -0.895  0.960  0.938  0.859

               Factor1
SS loadings      3.342
Proportion Var   0.835

Test of the hypothesis that 1 factor is sufficient.
The chi square statistic is 0.5 on 2 degrees of freedom.
The p-value is 0.777 Finding the print method (1)
A single object matching 'print.factanal' was found
It was found in the following places
  registered S3 method for print from namespace stats
  namespace:stats
with value

function (x, digits = 3, ...)
{
    cat("\nCall:\n", deparse(x$call), "\n\n", sep = "")
    cat("Uniquenesses:\n")
    print(round(x$uniquenesses, digits), ...)
    print(x$loadings, digits = digits, ...)
    if (!is.null(x$rotmat)) {
        tmat <- solve(x$rotmat)
        R <- tmat %*% t(tmat)
        factors <- x$factors
        rownames(R) <- colnames(R) <- paste0("Factor", 1:factors)
        if (TRUE != all.equal(c(R), c(diag(factors)))) {
            cat("\nFactor Correlations:\n")
            print(R, digits = digits, ...)
        }
    }
    if (!is.null(x$STATISTIC)) {
        factors <- x$factors
        cat("\nTest of the hypothesis that", factors, if (factors ==
            1)
            "factor is"
        else "factors are", "sufficient.\n")
        cat("The chi square statistic is", round(x$STATISTIC,
            2), "on", x$dof, if (x$dof == 1)
            "degree"
        else "degrees", "of freedom.\nThe p-value is", signif(x$PVAL,
            3), "\n")
    }
    else {
        cat(paste("\nThe degrees of freedom for the model is",
            x$dof, "and the fit was", round(x$criteria["objective"],
                4), "\n"))
    }
    invisible(x)
}
<bytecode: 0x10c0156d0>
<environment: namespace:stats>Finding the print method (2)
A single object matching 'print.loadings' was found
It was found in the following places
registered S3 method for print from namespace stats
namespace:stats
with value
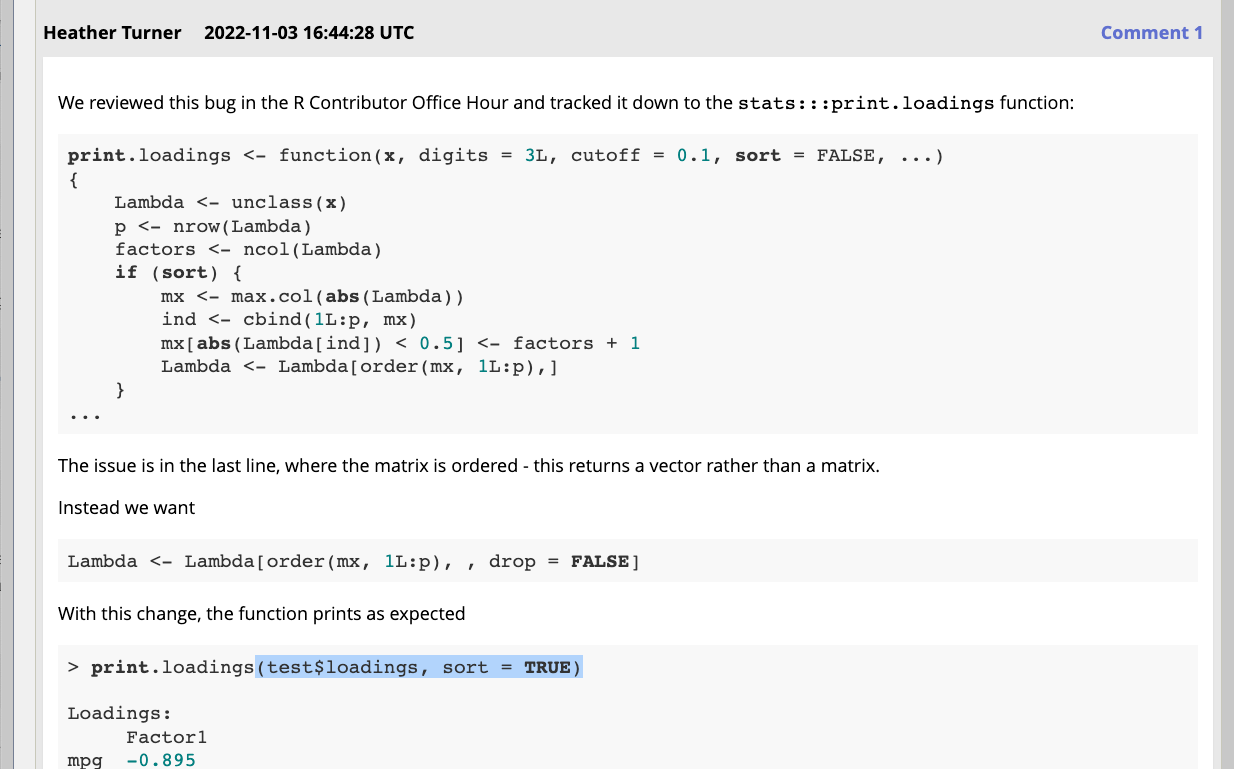
function (x, digits = 3L, cutoff = 0.1, sort = FALSE, ...)
{
Lambda <- unclass(x)
p <- nrow(Lambda)
factors <- ncol(Lambda)
if (sort) {
mx <- max.col(abs(Lambda))
ind <- cbind(1L:p, mx)
mx[abs(Lambda[ind]) < 0.5] <- factors + 1
Lambda <- Lambda[order(mx, 1L:p), ]
}
cat("\nLoadings:\n")
fx <- setNames(format(round(Lambda, digits)), NULL)
nc <- nchar(fx[1L], type = "c")
fx[abs(Lambda) < cutoff] <- strrep(" ", nc)
print(fx, quote = FALSE, ...)
vx <- colSums(x^2)
varex <- rbind(`SS loadings` = vx)
if (is.null(attr(x, "covariance"))) {
varex <- rbind(varex, `Proportion Var` = vx/p)
if (factors > 1)
varex <- rbind(varex, `Cumulative Var` = cumsum(vx/p))
}
cat("\n")
print(round(varex, digits))
invisible(x)
}
<bytecode: 0x10c031968>
<environment: namespace:stats>Debugging print.loadings
Call:
factanal(x = mtcars[, 1:4], factors = 1)

Uniquenesses:
  mpg   cyl  disp    hp
0.199 0.078 0.120 0.261
debugging in: print.loadings(x$loadings, digits = digits, ...)
debug: {
    Lambda <- unclass(x)
    p <- nrow(Lambda)
    factors <- ncol(Lambda)
    if (sort) {
        mx <- max.col(abs(Lambda))
        ind <- cbind(1L:p, mx)
        mx[abs(Lambda[ind]) < 0.5] <- factors + 1
        Lambda <- Lambda[order(mx, 1L:p), ]
    }
    cat("\nLoadings:\n")
    fx <- setNames(format(round(Lambda, digits)), NULL)
    nc <- nchar(fx[1L], type = "c")
    fx[abs(Lambda) < cutoff] <- strrep(" ", nc)
    print(fx, quote = FALSE, ...)
    vx <- colSums(x^2)
    varex <- rbind(`SS loadings` = vx)
    if (is.null(attr(x, "covariance"))) {
        varex <- rbind(varex, `Proportion Var` = vx/p)
        if (factors > 1)
            varex <- rbind(varex, `Cumulative Var` = cumsum(vx/p))
    }
    cat("\n")
    print(round(varex, digits))
    invisible(x)
}
Browse[2]> Press Enter to step through line by line
Browse[2]>
debug: Lambda <- unclass(x)
Browse[2]>
debug: p <- nrow(Lambda)Browse[2]>
debug: factors <- ncol(Lambda)Browse[2]>
debug: if (sort) {
mx <- max.col(abs(Lambda))
ind <- cbind(1L:p, mx)
mx[abs(Lambda[ind]) < 0.5] <- factors + 1
Lambda <- Lambda[order(mx, 1L:p), ]
}Browse[2]>
debug: mx <- max.col(abs(Lambda))Browse[2]>
debug: ind <- cbind(1L:p, mx)Browse[2]>
debug: mx[abs(Lambda[ind]) < 0.5] <- factors + 1Browse[2]>
debug: Lambda <- Lambda[order(mx, 1L:p), ]Print objects
Browse[2]> Lambda[order(mx, 1L:p), ]
       mpg        cyl       disp         hp
-0.8947285  0.9603623  0.9381177  0.8594404
Browse[2]> Lambda
Factor1
mpg -0.8947285
cyl 0.9603623
disp 0.9381177
hp 0.8594404Browse[2]> Lambda[order(mx, 1L:p), , drop = FALSE]
Factor1
mpg -0.8947285
cyl 0.9603623
disp 0.9381177
hp 0.8594404
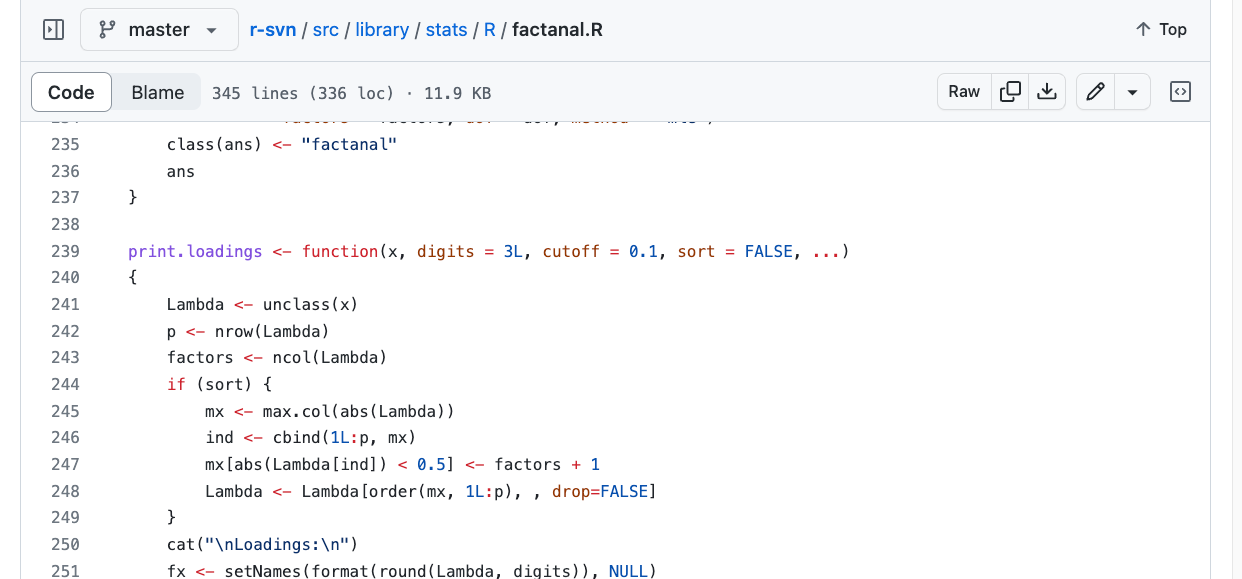
Browse[2]> Modify function
print.loadings <- function (x, digits = 3L, cutoff = 0.1, sort = FALSE, ...)
{
  Lambda <- unclass(x)
  p <- nrow(Lambda)
  factors <- ncol(Lambda)
  if (sort) {
    mx <- max.col(abs(Lambda))
    ind <- cbind(1L:p, mx)
    mx[abs(Lambda[ind]) < 0.5] <- factors + 1
    Lambda <- Lambda[order(mx, 1L:p), , drop = FALSE]
  }
  cat("\nLoadings:\n")
  fx <- setNames(format(round(Lambda, digits)), NULL)
  nc <- nchar(fx[1L], type = "c")
  fx[abs(Lambda) < cutoff] <- strrep(" ", nc)
  print(fx, quote = FALSE, ...)
  vx <- colSums(x^2)
  varex <- rbind(`SS loadings` = vx)
  if (is.null(attr(x, "covariance"))) {
    varex <- rbind(varex, `Proportion Var` = vx/p)
    if (factors > 1)
      varex <- rbind(varex, `Cumulative Var` = cumsum(vx/p))
  }
  cat("\n")
  print(round(varex, digits))
  invisible(x)
}Check
Documentation Bug exercise: Bug 17699
https://bugs.r-project.org/show_bug.cgi?id=17699
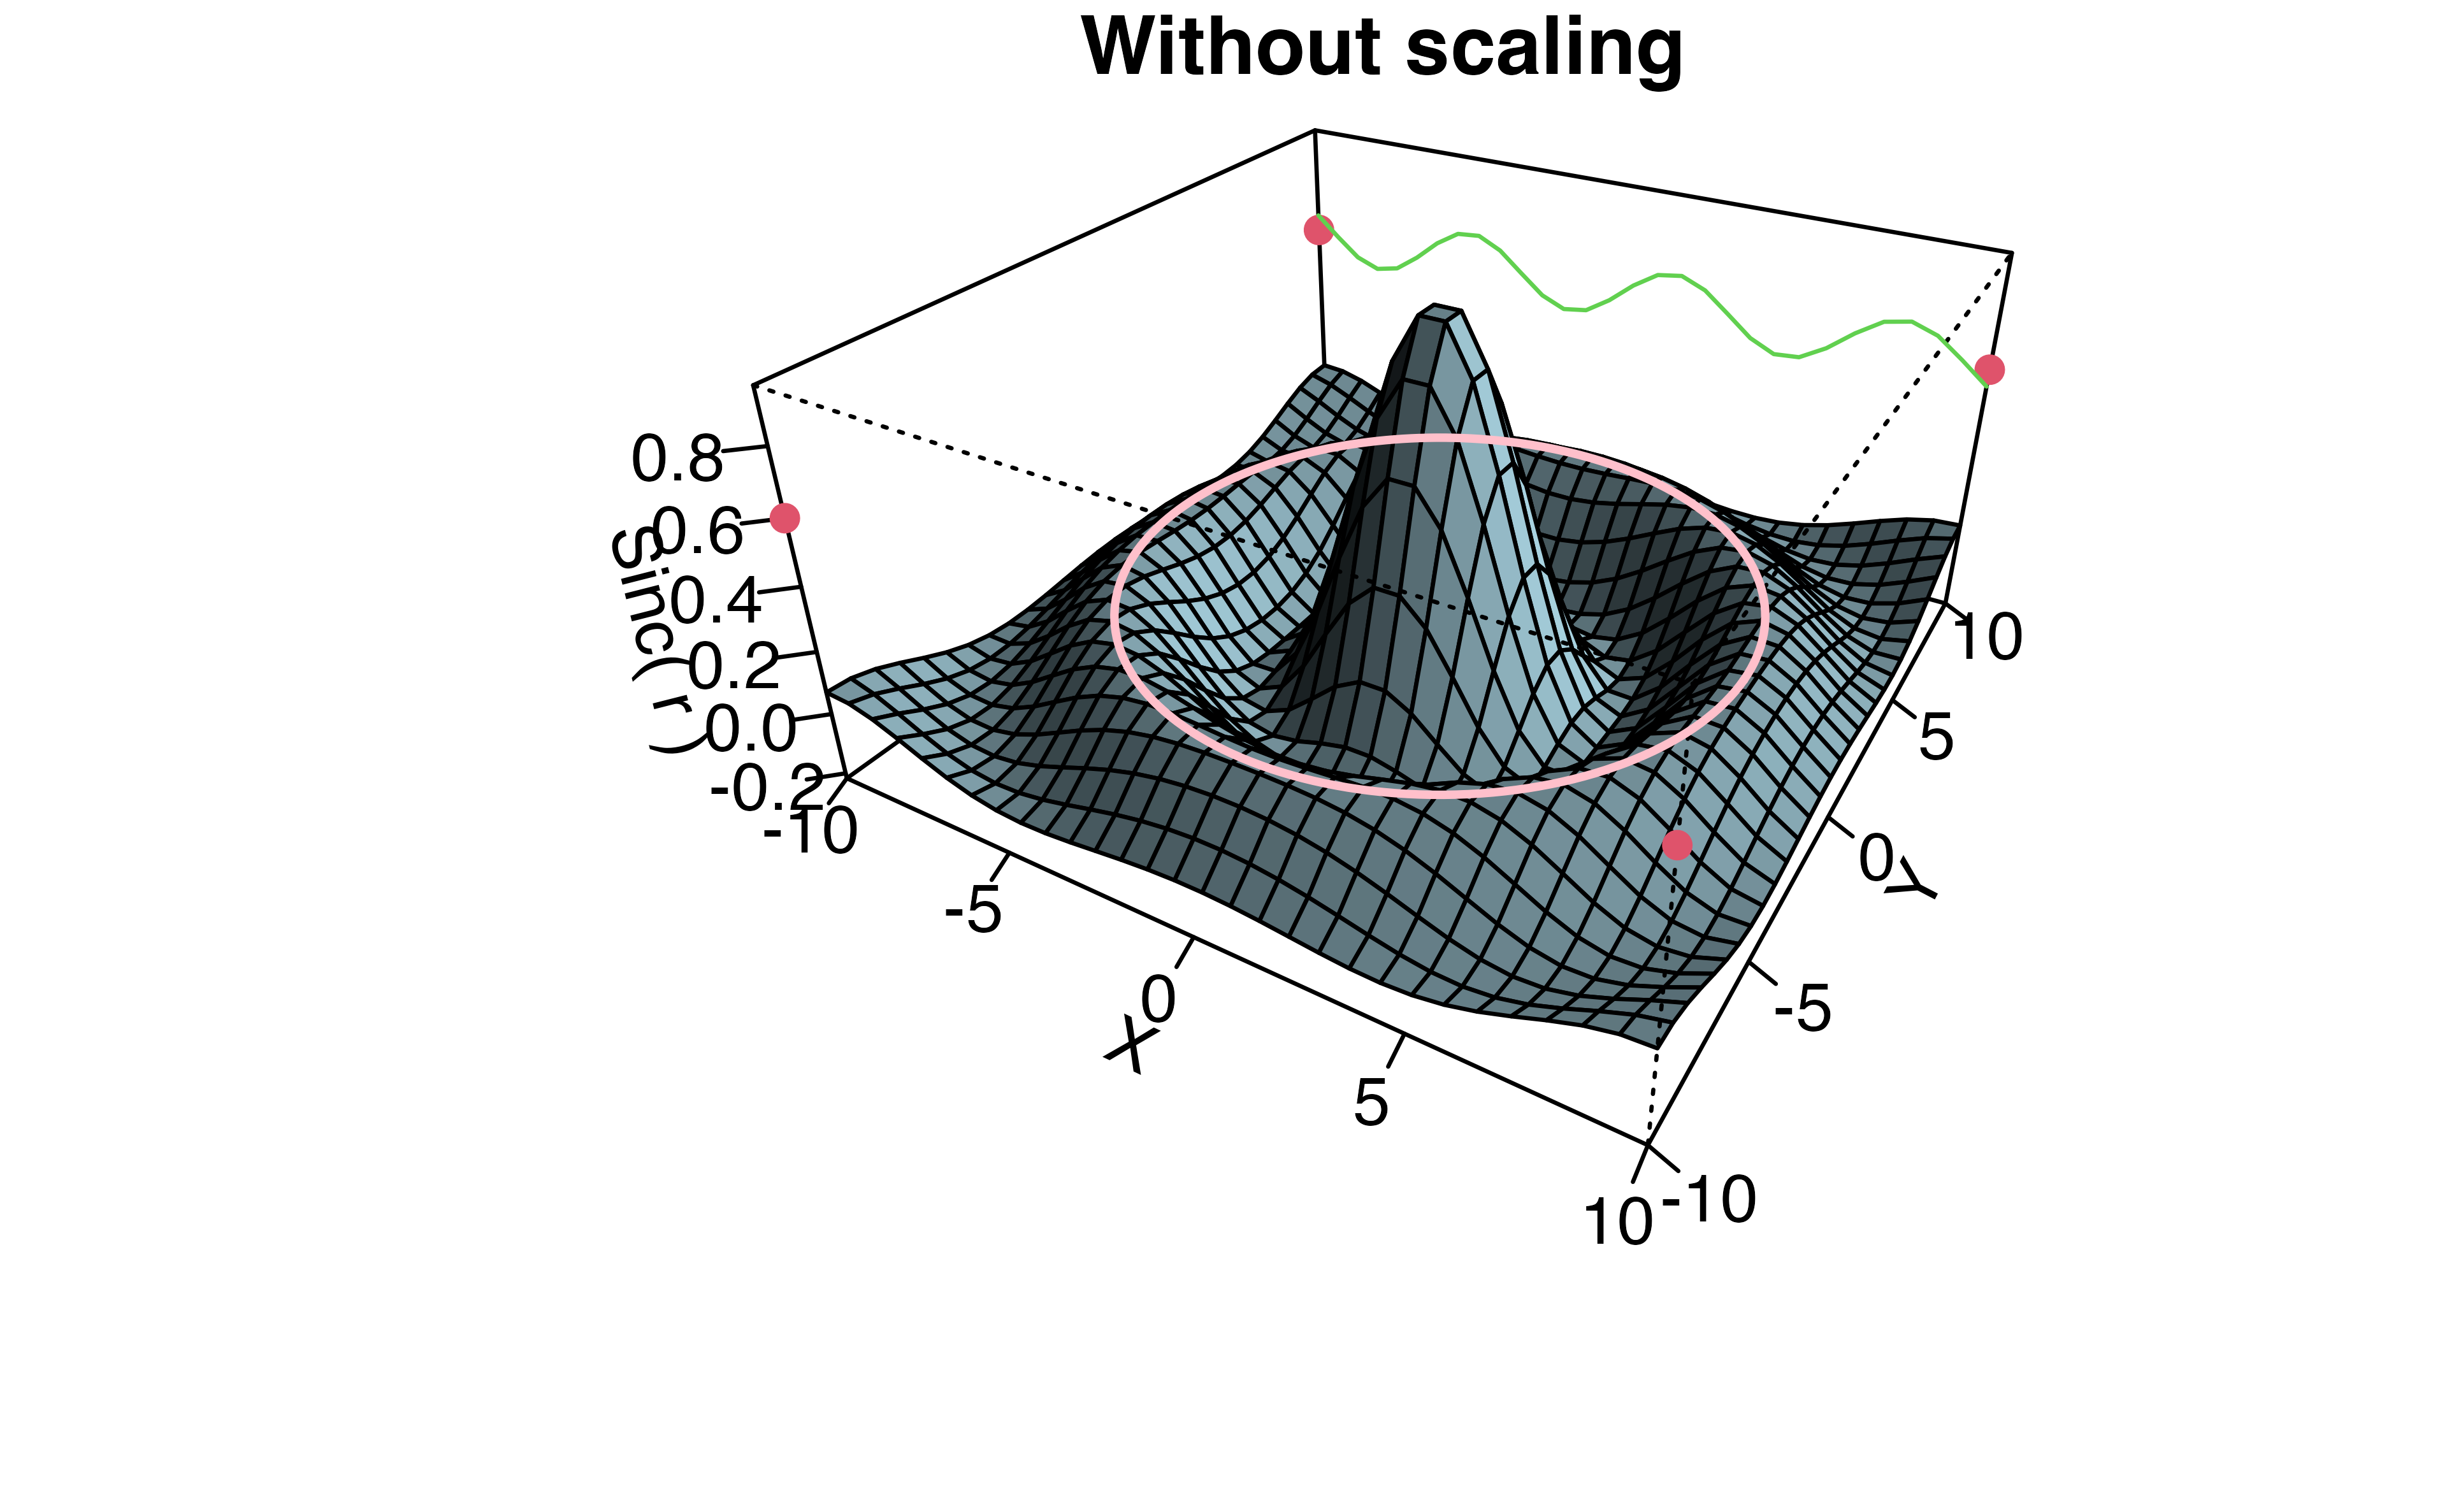
Summary: trivial error in persp example
Reprex:
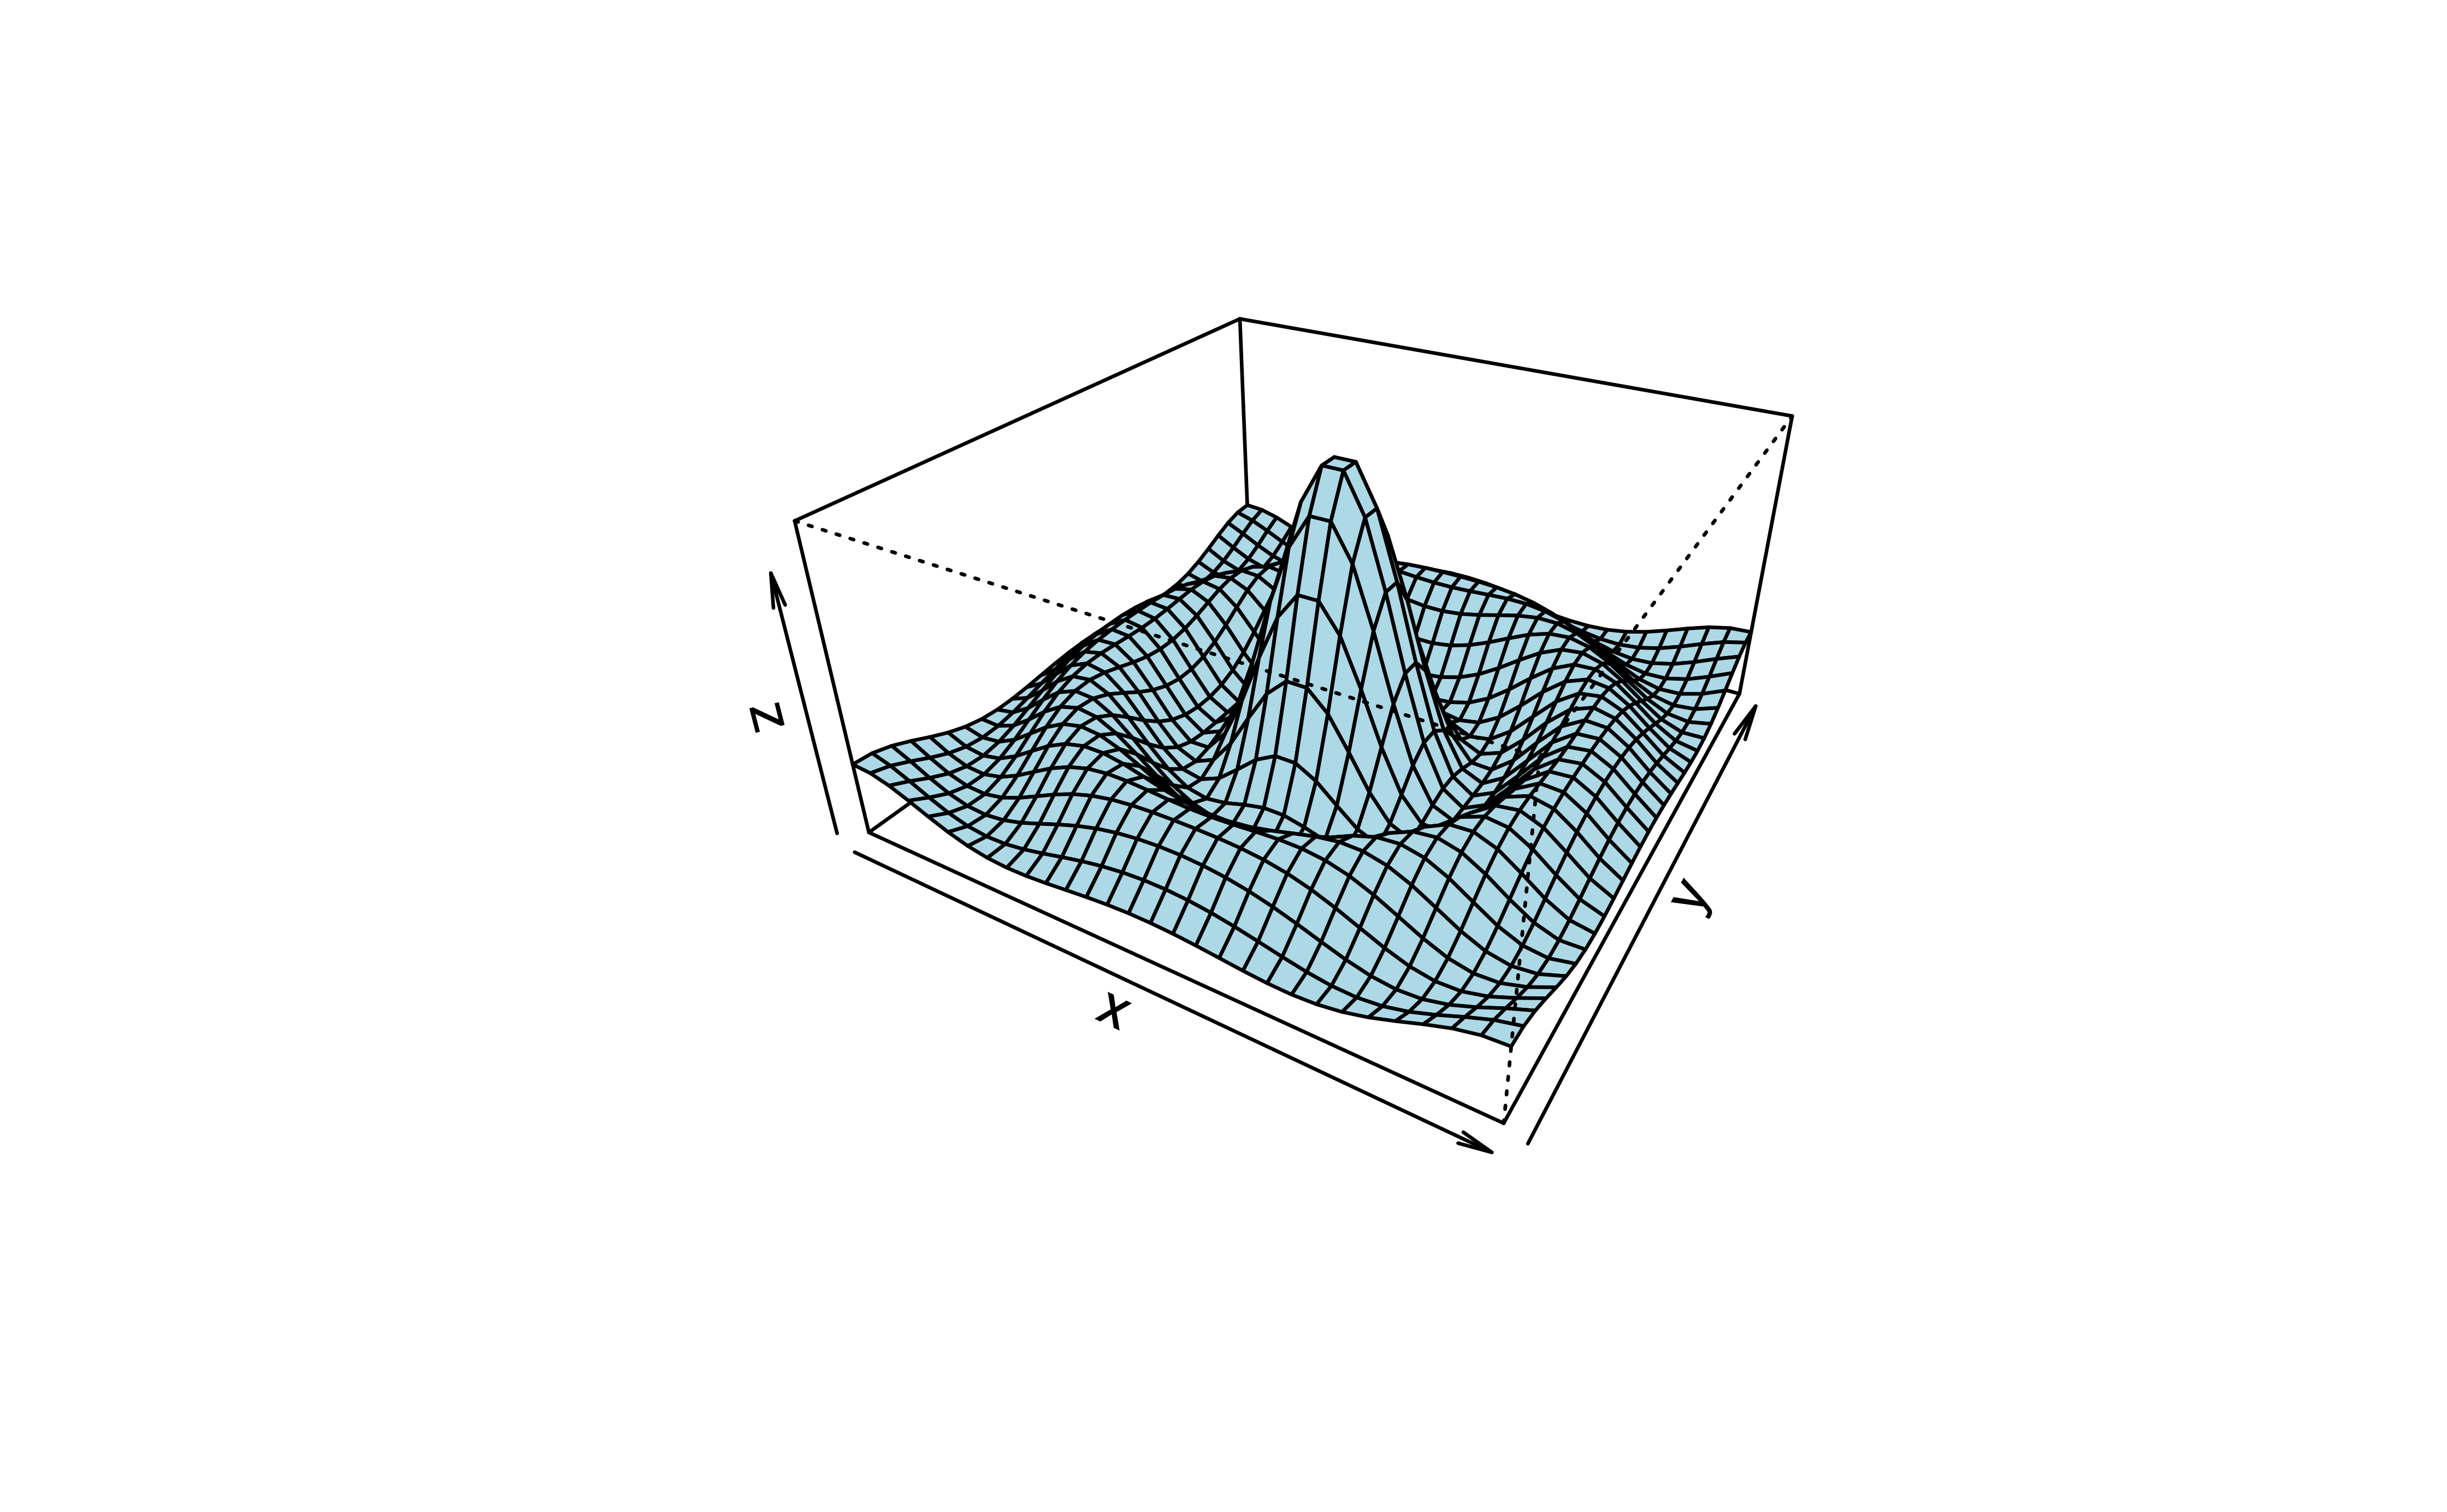
# (1) The Obligatory Mathematical surface.
#     Rotated sinc function.

x <- seq(-10, 10, length = 30)
y <- x
f <- function(x, y) { r <- sqrt(x^2+y^2); 10 * sin(r)/r }
z <- outer(x, y, f)
z[is.na(z)] <- 1
Reported Problems:
is.na(z)implies that there areNAs - but there aren’t!- The limit of {10 * sin(r)/r} as x and y approach zero is 10 not 1.
Suggested Solutions:
- Change the length to 31, so there is a single
NaNand handleNAswithin the functionf. - Set z to 10, where there’s NaN(s) OR Remove the
10 *
Q1. Is this issue still present?
(Prior to R 4.2.2) Yes, ?graphics::persp has the code as shown in the bug report
- This code still gives the same result in current R
Q2a: Is the reporter’s analysis correct? (NAs)
- In the reprex, there are no
NAs inz.
- If we change the length of
xandyto 31,zdoes haveNA
Q2a (ii) When is z equal to NA?
Q2b: Is the reporter’s analysis correct? (Definition)
- The limit of {10 * sin(r)/r} as x and y approach zero is 10 not 1.
Check the definition of the sinc function e.g. on Wikipedia \[ \text{sinc } x = \frac{\sin x}{x} \] The value at \(x = 0\) is defined to be the limiting value \[ \text{sinc } 0 := \lim_{x \rightarrow 0} \frac{\sin x}{x} = 1\]
(The full definition of f is the “rotated sinc function” which computes the sinc function for the radius of a circle centred at co-ordinates 0,0)
Q2b (ii): Why was the scaling by 10 added?
Continuing through example, a second persp plot is created from the data with axis ticks, lines and points.
- Maybe the scaling is so the z axis labels are less crowded?
- Maybe to simplify the code to add the sin wave (green line)?

Q3: How should we fix the issue? (NAs)
Option 1: Change the length of x and y to 31 and handle NAs within the function f.
- Follows the full definition of the sinc function
- General solution for any length of
xandy
Option 2 (new idea): Keep the length at 30 and don’t handle NAs at all
- We know there are no
NAs in this case - Simplifies example
Q3: How should we fix the issue? (Definition)
Option 1: Set z to 10 if there are any NAs
- Don’t need to change code for second persp plot
- Plot + code for second plot slightly neater
Option 2: Remove the scaling by 10
- Follows the definition of the sinc function: easier to follow
- Simplifies initial code (as in reprex)
- Maybe we can adjust parameters to improve axis labels
What happened in the end?
| Contributor proposal (via patch) | R Core Reviewer |
|---|---|
| Remove handling of NAs for being unnecessary | Agreed with this, after considering both options |
| Remove the scale of function f as not needed by definition | Agreed scaling is not necessary, but also did not see a need to remove it |
| Changed the axes and label font size to 0.62 and 0.8 respectively to make the second graph clear | Thought this a matter of taste, but did make a simpler change along these lines |
| Modify the z-axis values of trans3d in both points and lines to account for the removal of the scale in | Thought it simpler to keep the scale |
Tip
Make minimal change to fix the issue.
How to propose a fix
Comment on Bugzilla
For bug 17863 (print.loadings bug) it was enough to propose the fix in a comment
Create a patch via GitHub
Alternatively, create a patch using the r-svn mirror of the R sources: https://github.com/r-devel/r-svn
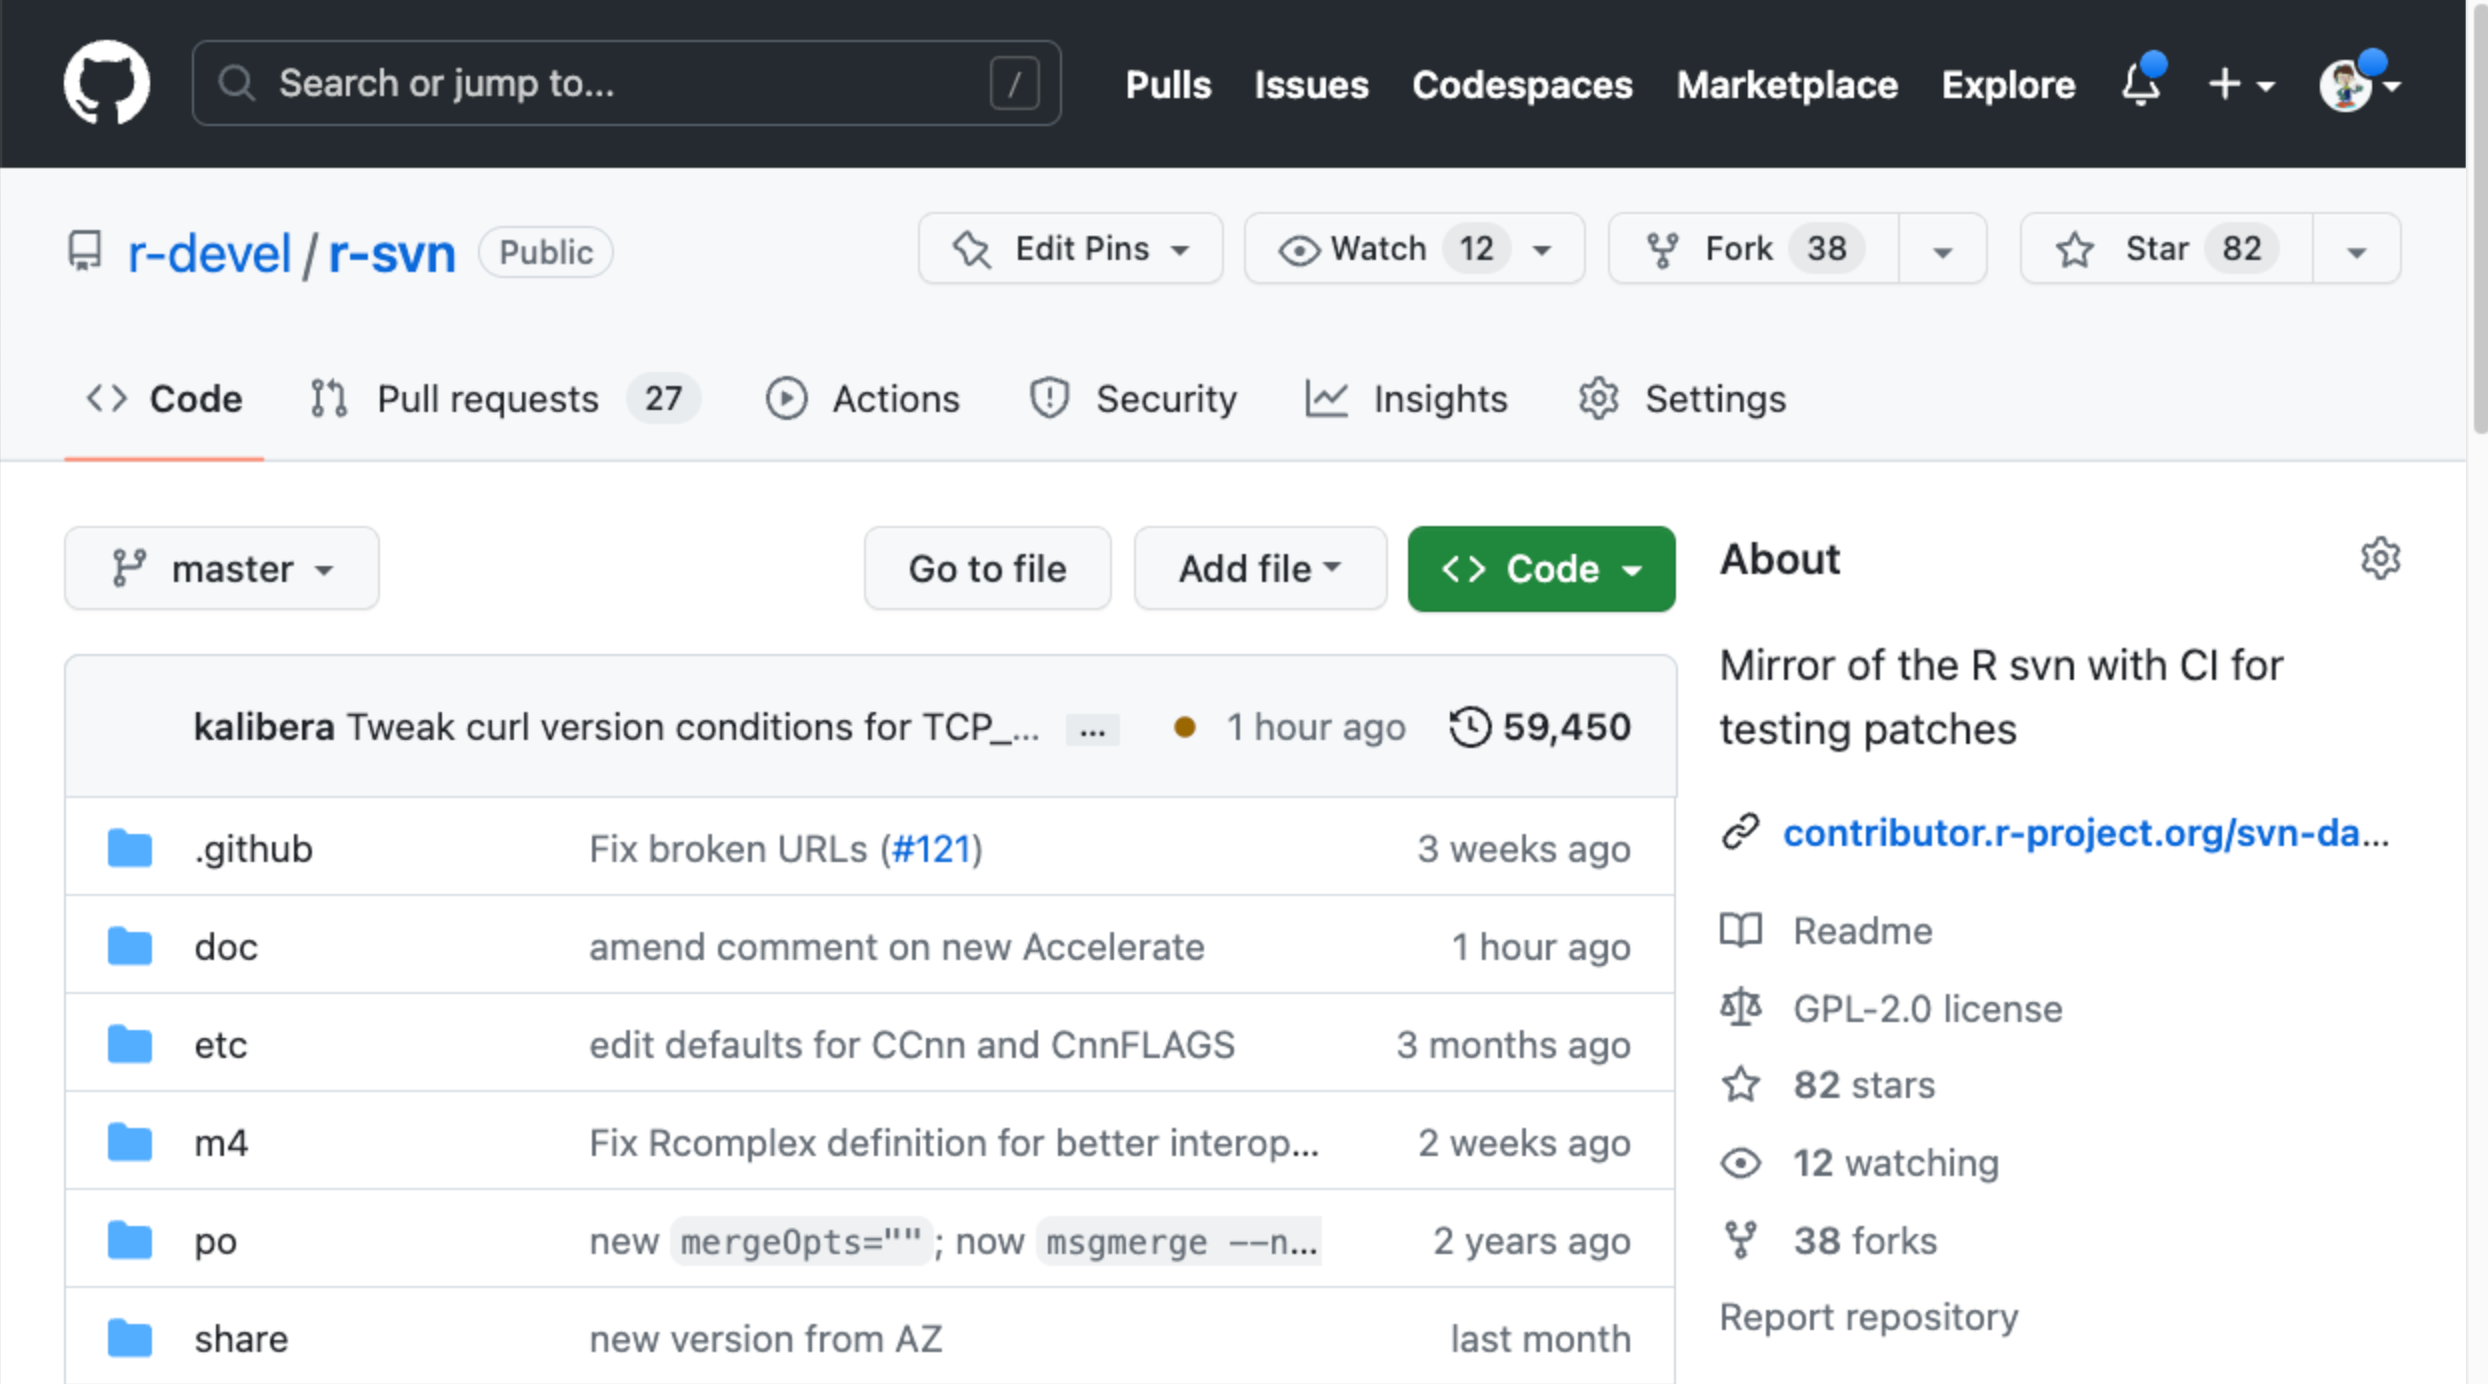
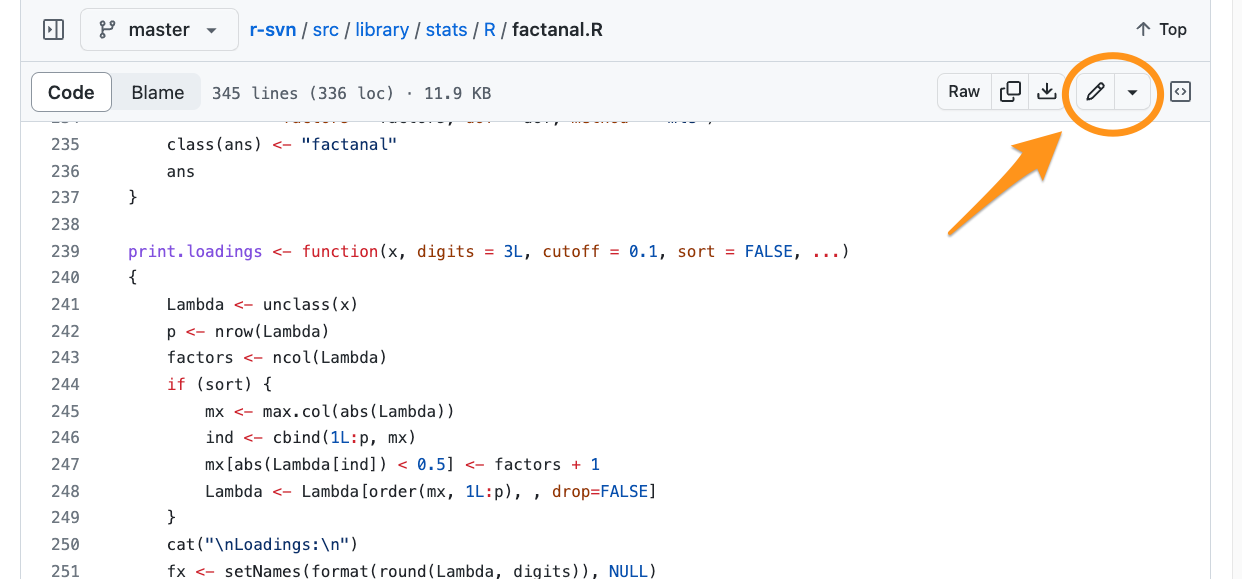
Find source file to edit
This will create a fork of the r-svn repo on your GitHub account.
Edit the code in the browser
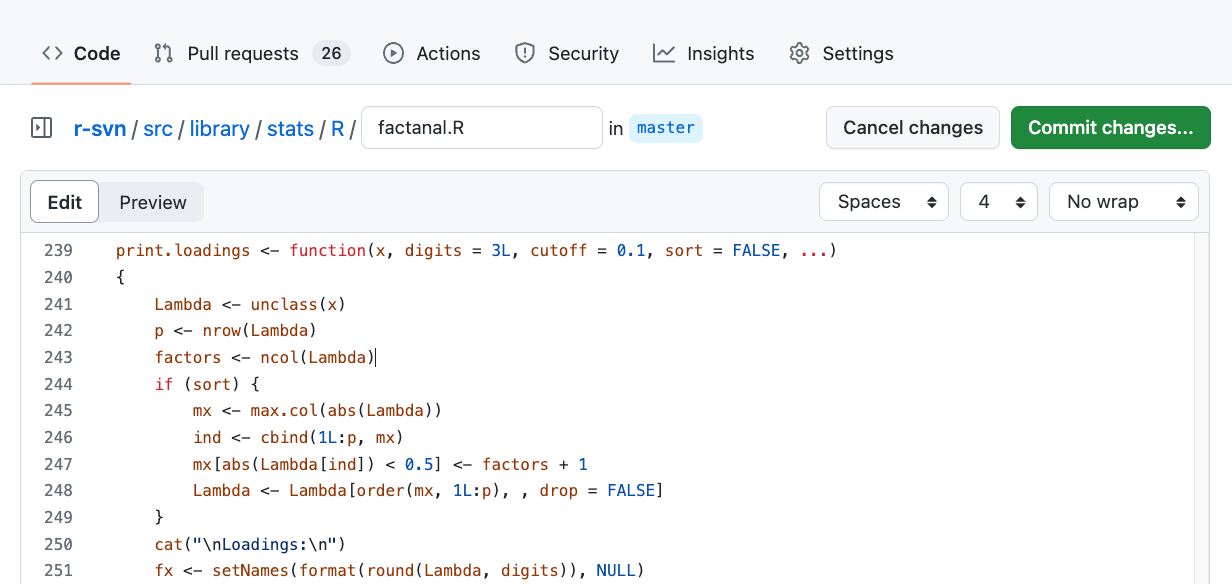

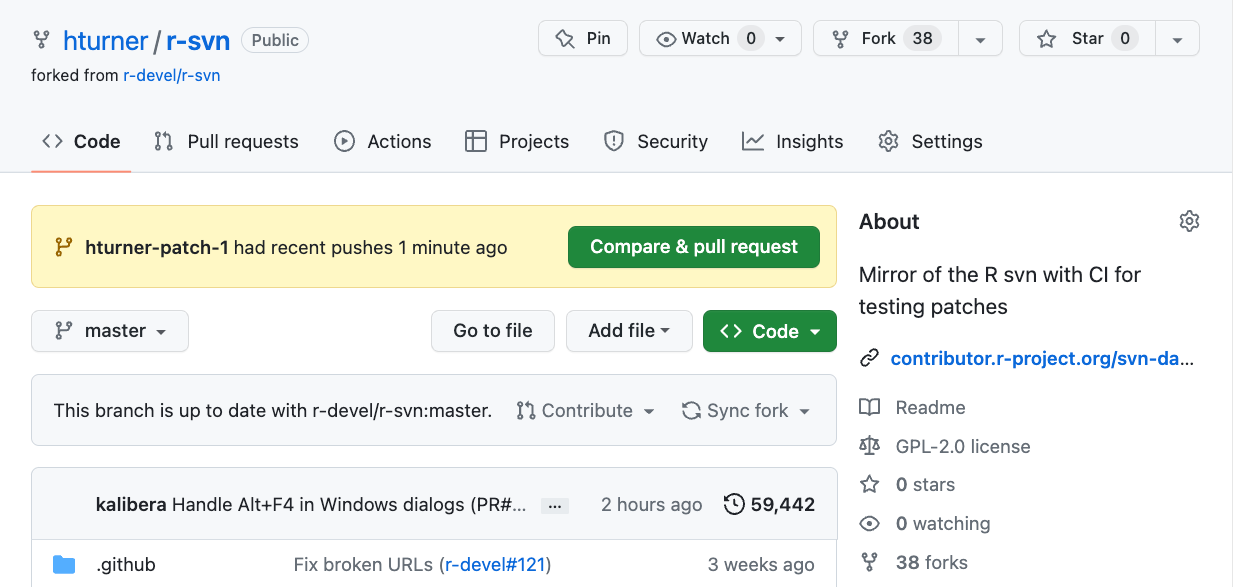
Committing changes will create a branch on your fork
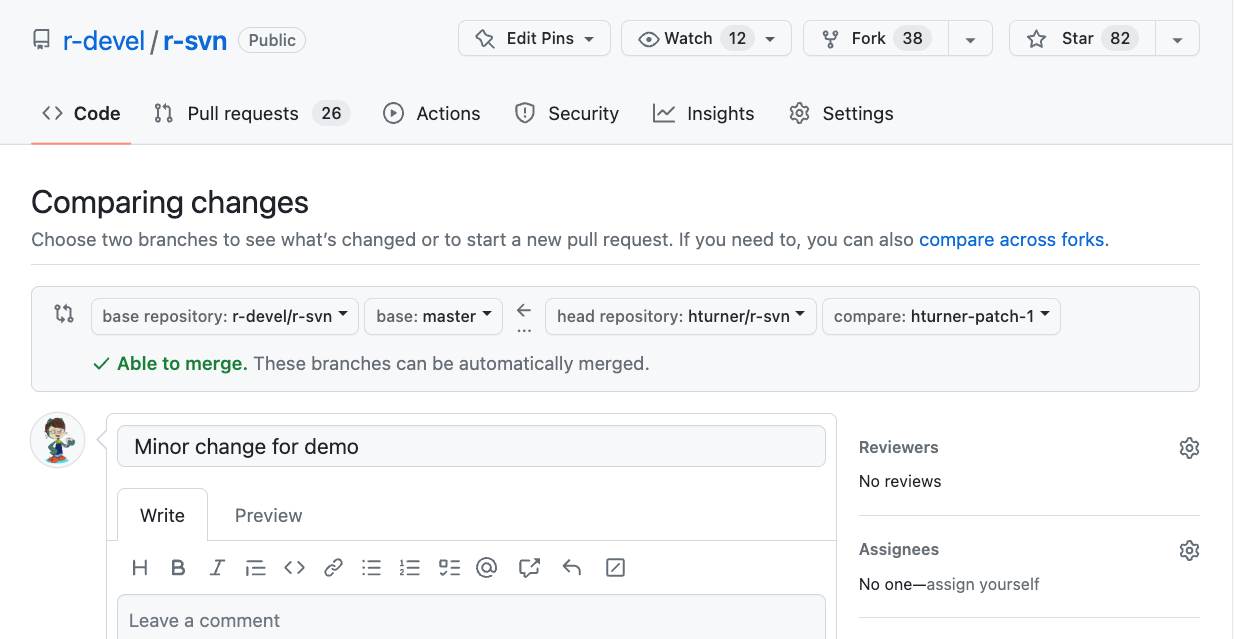
Open a PR (1)
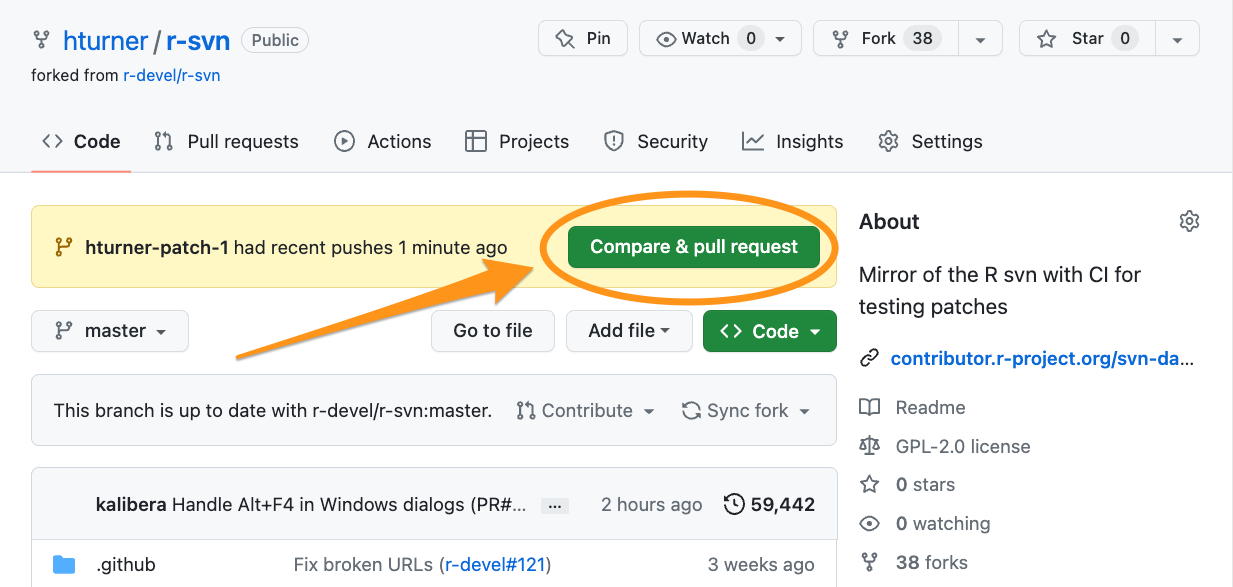
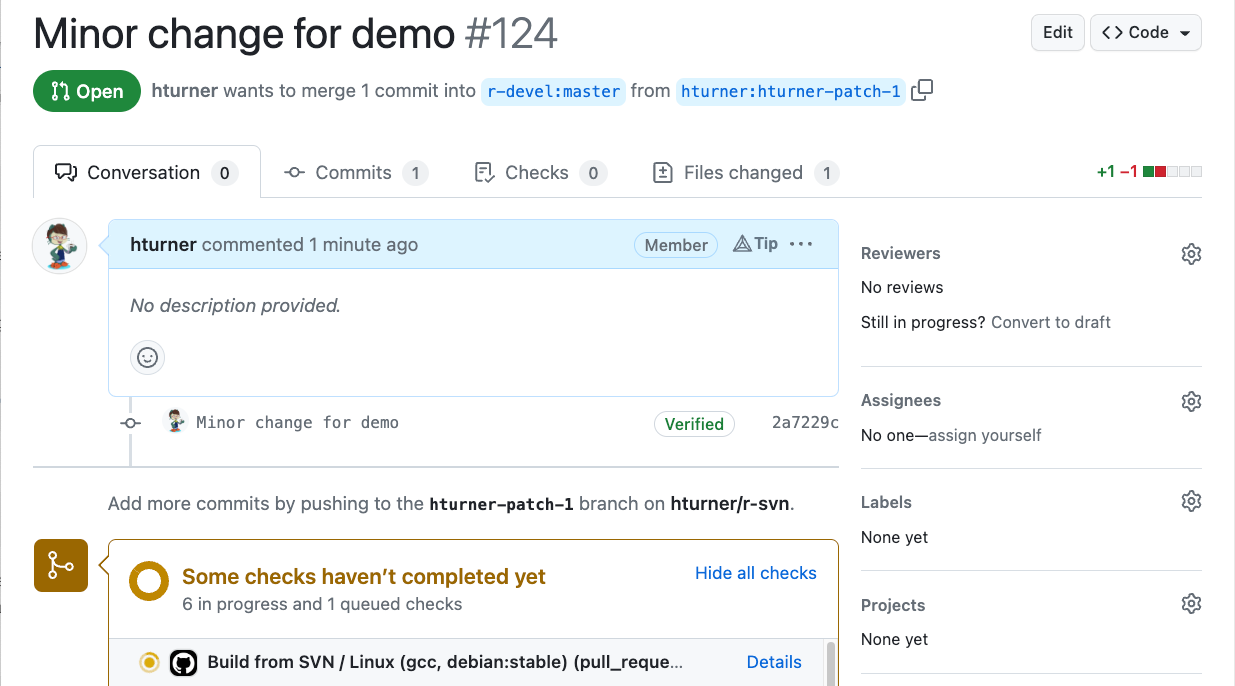
Open a PR (2)

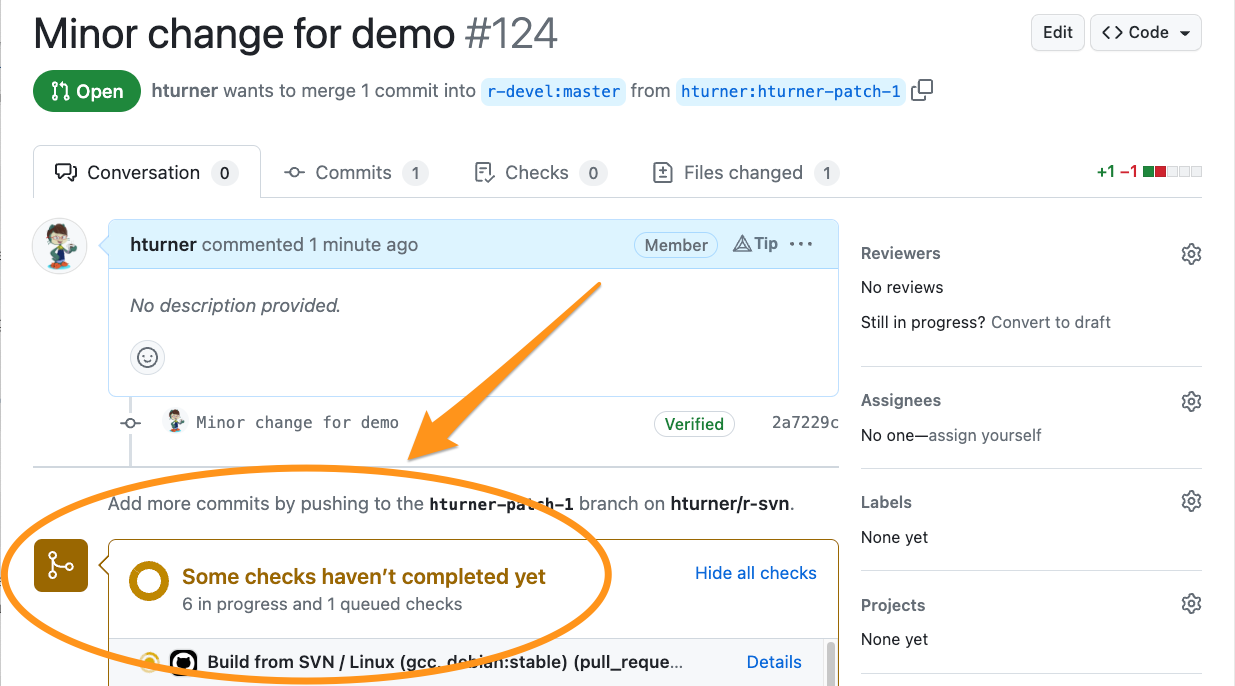
Automated checks
Create a patch
Add .diff to the URL for your PR, e.g. https://github.com/r-devel/r-svn/pull/124.diff
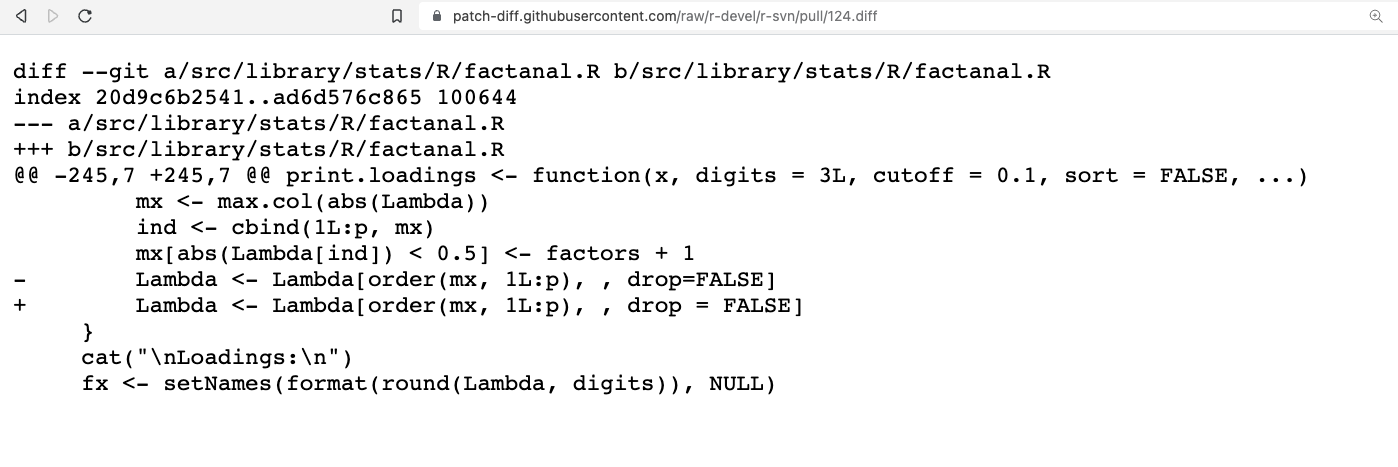
Right-click to save .diff file.
This patch can be attached to the Bugzilla report, with a comment.
Informal review
An advantage of creating the patch on GitHub is that you can ask another contributor to review the changes before posting on Bugzilla.
See https://github.com/r-devel/r-svn/pull/103 for an example discussing the change to the persp documentation (Bug 17699).
Going forward
Caveats
This demo has focused on good first issues
- Most bug reports are not so clear
- Many bugs in R are actually in the C code
- Modifications to C code, or R code that is called indirectly requires re-building R to test
- This is not as easy as using devtools to load package code
There is still lot of scope for new contributors!
Where next?
![]()
Links
R Contributor Office Hours: https://contributor.r-project.org/events/office-hours/
R Contributor Slack: https://contributor.r-project.org/slack
How to get a Bugzilla account: https://contributor.r-project.org/rdevguide/BugTrack.html#RCorePkgBug
R Development Guide: https://contributor.r-project.org/rdevguide/
Slides for this demo: https://hturner.github.io/contributing-demo